Is the media biased toward Clinton or Trump?
Weekly Example of Media Bias — Posted on September 21, 2016
Excerpted from an article by John Sides, Washington Post .com on September 20:
University of Pennsylvania senior Jack Beckwith and friend Nick Sorscher launched the website Data Face last October. They assembled a team of three “data journalists” who investigate topics in music, politics and sports. …[One such topic was] how positively (or negatively) the media has treated each 2016 presidential candidate. All of their articles rely on data that they collect themselves and present in interactive visualizations.
John Sides of The Washington Post interviewed the team about their report on how fairly the media is treating presidential candidates Hillary Clinton and Donald Trump.
How did you go about measuring media coverage of Hillary Clinton and Donald Trump?
We compiled a total of 21,981 articles written about the election dating back to July 1, 2015. To be included in our data set, each article had to reference either Donald Trump or Hillary Clinton in its headline (but not both). The articles came from the websites of eight major media outlets: the New York Times, The Washington Post, Chicago Tribune, Wall Street Journal, Slate, Politico, Fox News and the Weekly Standard. We wanted a mixture liberal and conservative outlets, at least according to conventional wisdom.
We looked at the number of articles that were published about each candidate over time, which captures their ability to dictate the news cycle. And using the actual text of the articles, we evaluated the tone of the coverage — how positive or negative it was toward each candidate — and how it has shifted throughout the campaign.
How do you know whether a story is positive or negative about either of the candidates?
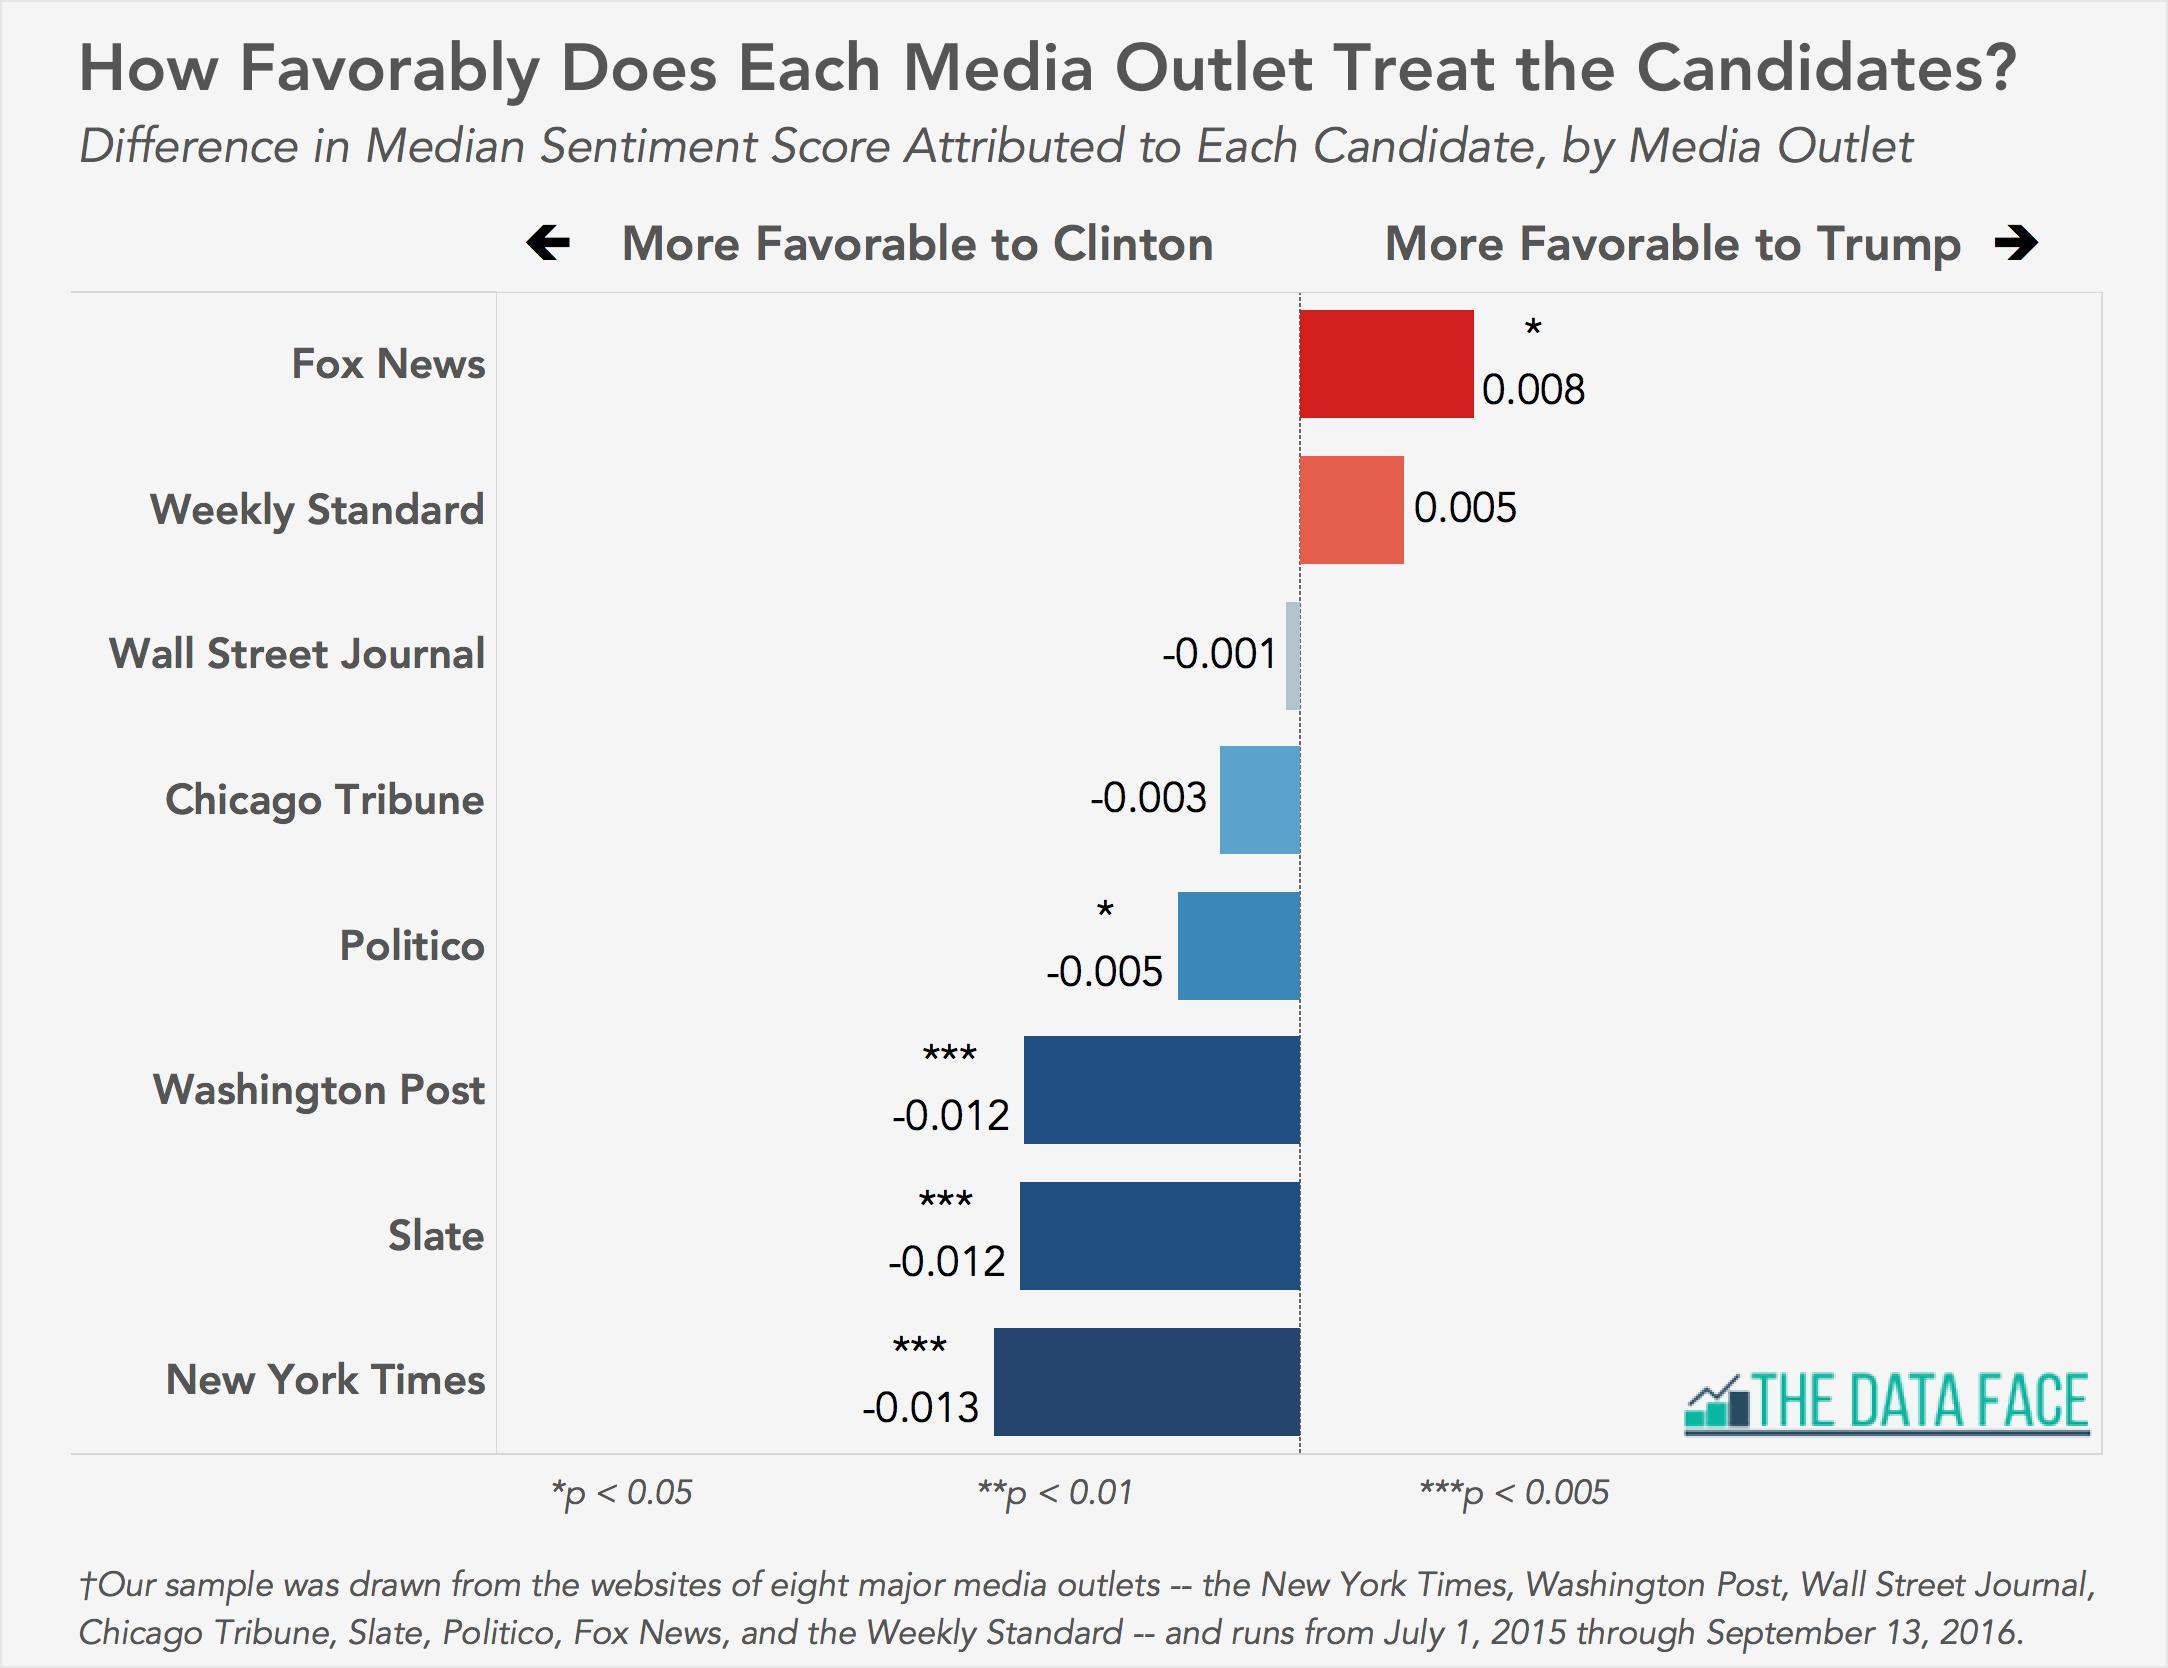
We did this via a computer algorithm, which is becoming increasingly common as social scientists work with huge data sets of text. There are a variety of approaches to what’s often called sentiment analysis, but our methodology was this: for each article, the algorithm identified every adjective. Then, using a very large word bank, it scored the adjectives on a scale of -1.0 (most negative) to +1.0 (most positive). The computer then averaged those values to generate an overall sentiment score for each article.
This obviously isn’t perfect. A computer’s sense of sentiment can be tripped up by things like satire, slang or misspellings. But given that we were working with news articles (the Onion wasn’t among our outlets), we believe these concerns are less relevant. Moreover, sentiment analysis has been shown to be surprisingly effective in predicting the stock market, summarizing customer feedback and delineating a population’s political views.
What about the individual outlets? Are there differences in how they cover the candidates?
We found that all of the media outlets that we considered “liberal” treated Clinton more favorably. The more conservative outlets seemed more on the fence about Trump. In our sample of articles, only the coverage of Fox News was more positive toward Trump than Clinton, at least to a statistically significant degree. Coverage at Weekly Standard, Wall Street Journal and Chicago Tribune didn’t clearly favor one candidate or the other.

